Role: Senior Visual Designer
Scope: Website Redesign · Interactive Product Storytelling · Visual Systems
Contributions: Visual Direction · Information Hierarchy · Web Design · Interactive Prototyping · Webflow Development
Tools: Figma · Webflow · Illustrator · AI-assisted workflows · HTML/CSS/JS
Outcome: 25+ Pages & Templates · 4 Product Launches · +70% Site Sessions
A website that needed
to catch up.
Sitemetric is growing, but its website wasn't keeping up. The existing site didn't reflect where the company was headed or clearly communicate its expanding range of products, services, and capabilities.
As Senior Visual Designer, I lead visual design across much of the site, creating clearer ways to organize and communicate an increasingly complex offering. The Safety experience is one example: what was previously a feature-led page evolved into a more intentional story around moving from reactive to proactive safety.
As the work has evolved, I've also introduced interactive visuals and custom-coded motion across the site to make product capabilities easier to understand and bring the experience to life.

Existing Safety experience
Feature-led safety story

Redesigned Safety experience
Proactive safety narrative - In development
Approach
Design the system, not just the page.
Rather than treating each page as a one-off, I focused on working within and extending a flexible visual system that could grow with the site. This approach made it easier to test ideas, iterate quickly, and adapt the experience as new content and product needs emerged.

Interactive Product Storytelling
Making the product easier to understand.
Sitemetric’s platform does a lot, and some of its capabilities can be difficult to communicate through copy or static screenshots alone. I began using interactive product visuals, motion, and custom-coded experiences to show how features work and make complex ideas easier to understand.
The goal wasn’t interaction for the sake of interaction. Each visual needed to help explain something more clearly, whether showing how AI detects activity, how workforce data moves through the platform, or how different capabilities connect.
These were built with Claude as a coding collaborator. The real work was in the direction: pushing the output through enough rounds of refinement that every component felt like it came from the same visual system, not just the same prompt.
Designing at Scale
From individual pages to a digital system.
As the website expanded, so did the way I worked. What started with individual page improvements now spans a digital experience of more than 25 pages and templates across products, solutions, industries, and content.
My workflow evolved too, moving from Figma into AI-assisted prototyping with Claude for faster exploration and refinement, then into Webflow for implementation. This has helped me move more quickly as new pages, launches, and content needs emerge.
Research + Optimization
I began by auditing competitor websites and exploring SEO, AEO, and emerging AI search behavior, which helped surface opportunities for how Sitemetric could improve its content and discoverability. That early research helped inform the team’s broader SEO efforts, with marketing and content partners building on the findings and providing the strategy and content inputs I needed to translate them into the website experience.
Performance was also part of my design process. As I introduced motion and interactive experiences, I worked to keep them lightweight and purposeful so they added to the experience without unnecessarily slowing it down.
Collaboration + Iteration
A team effort, built to evolve.
The website is a collaborative effort across our team. I lead visual design across much of the site, while concepts are shared early, challenged, and shaped through feedback. Copy, strategy, product expertise, and technical considerations all influence the final experience, with each person bringing their expertise to the work.
Our process is intentionally iterative. We build and launch an initial experience, then return to test, optimize, and refine it as we learn from performance, analytics, search behavior, and evolving business needs. Rather than treating a page as finished at launch, we continue improving the experience over time.
Outcome
A stronger foundation, still evolving.
The website has become a clearer, more dynamic expression of Sitemetric’s platform and where the company is headed. Since the redesign began, site sessions have increased by 70%, while the visual system has expanded across 25+ pages and templates and supported four product and service launches.
The work is still evolving. As Sitemetric grows, I continue to refine the system, explore new ways to communicate complex capabilities, and build a digital experience that can grow with the company.
Metrics reflect results and project scope as of August 2026.
+70%
Site sessions
25+
Page & Templates
4
Product & Services launches
More projects
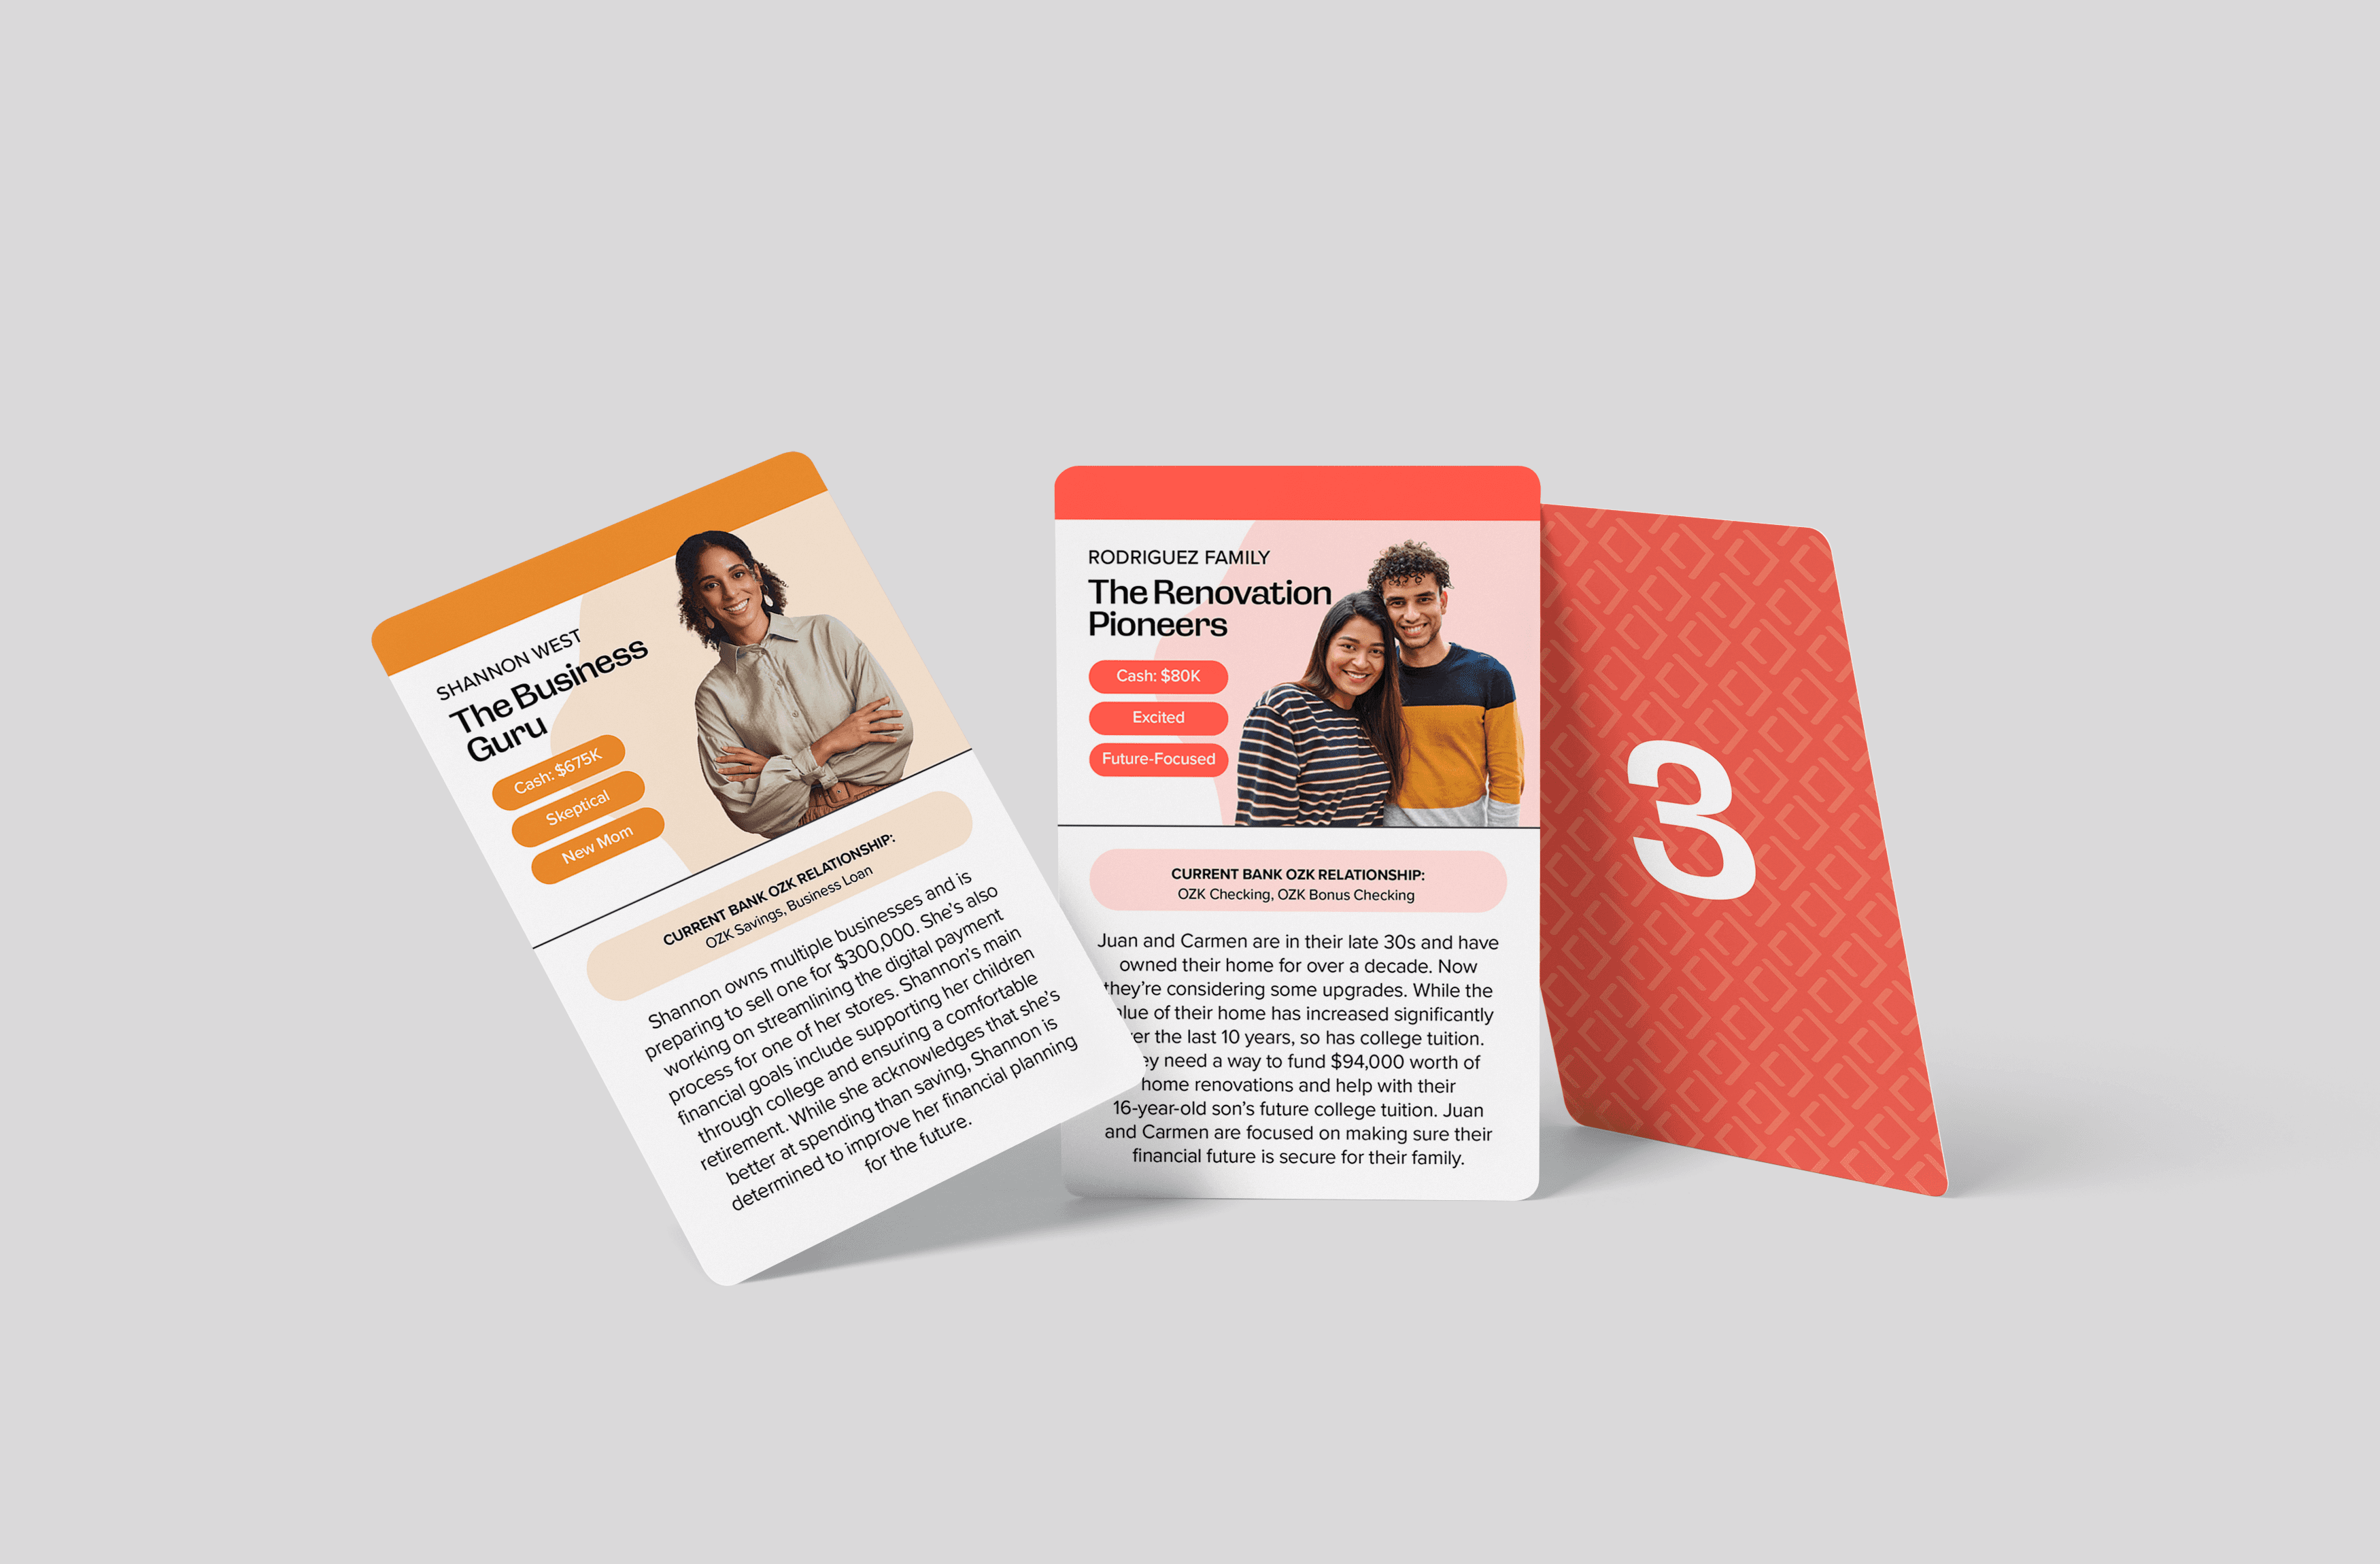
Bank OZK
A scenario based learning experience designed to help banking teams build stronger customer conversations.
View project →
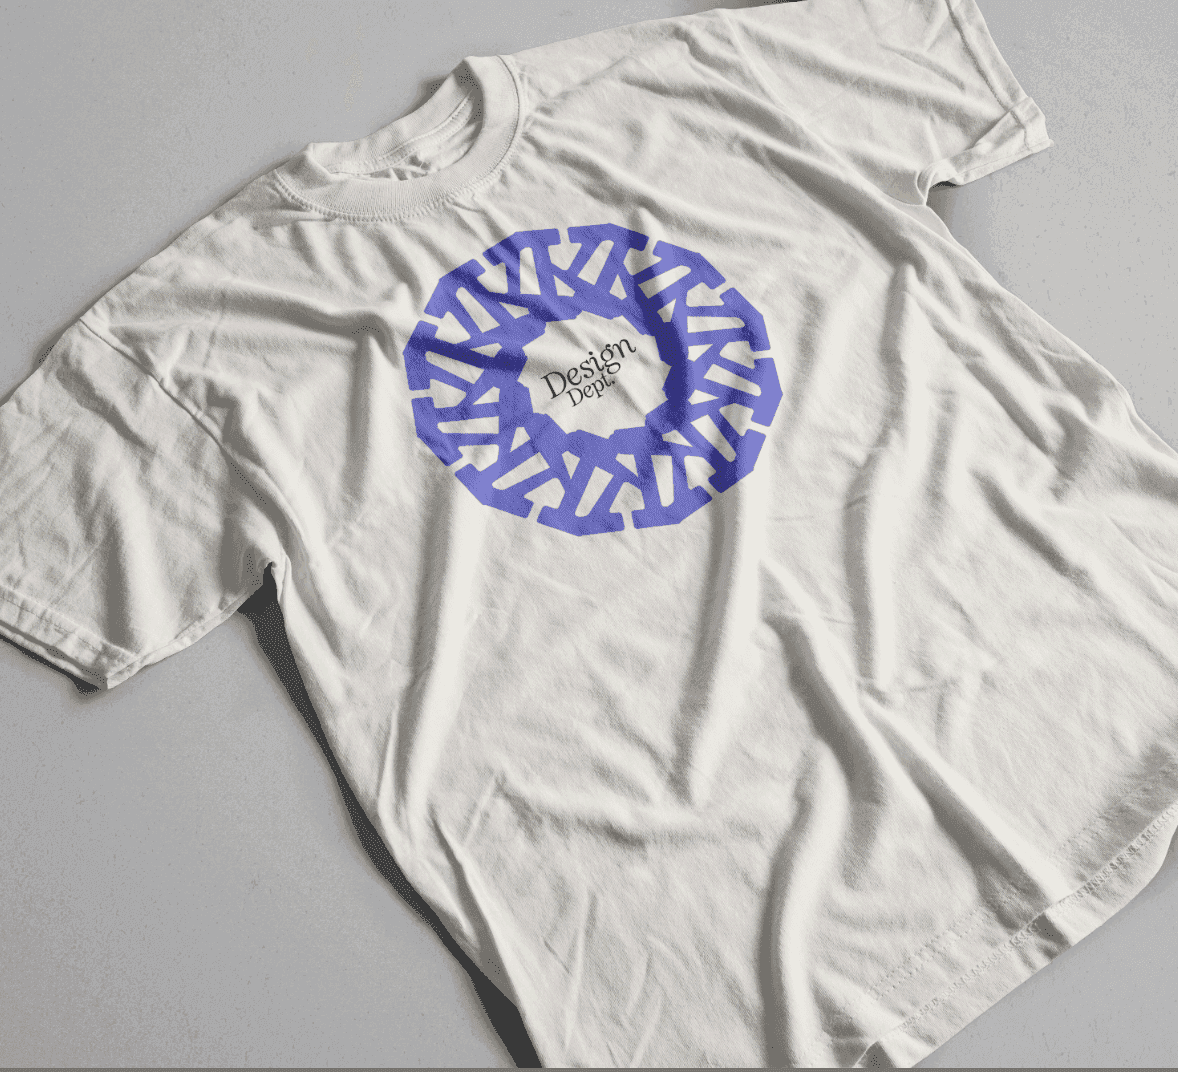
Typhlora™
An experimental typographic system exploring structure, repetition, and how design principles become visual language.
View project →

Exhibit
Identity and campaign design for a cultural philanthropy exhibit spanning print, digital, and merchandise.
View project →